
We are now midway between the 2011 census and the next one in 2021, and that has significant implications for our understanding of even basic trends in population and households.
The UK census has been undertaken every ten years since 1801 (with the exception of 1941 and Ireland in 1921). It is a valuable resource and provides a unique opportunity to analyse and understand the housing market. However, as we get further from the previous census, we become more dependent on other surveys and data for up-to-date analysis. And, although the census may not be perfect, these alternative resources are inevitably constrained due to their smaller scope and sample. Therefore our understanding of how the country and the housing market is changing becomes increasingly uncertain as we get closer to the next census.
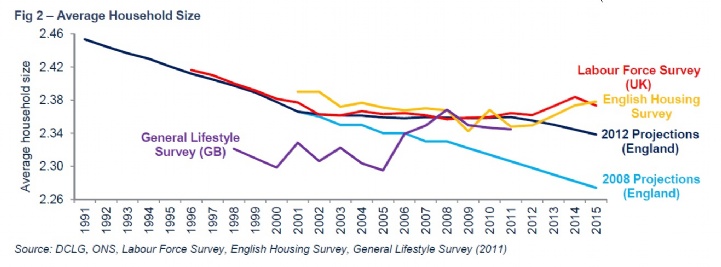
This uncertainty appears in even the most basic of variables. There is currently considerable debate about the level of net migration into the country and hence there is uncertainty over how many people actually live here. Even if we ignore migration data issues, it is still difficult calculating how many households there are. The 2008 projections had over-estimated the number of households in 2011 despite the population turning out higher than expected. We are now seeing a similar divergence between the 2012 household projections and the Labour Force Survey. Meanwhile the English Housing Survey provides a more volatile measure.



.png)
.png)