
Research article

Home buyer's income

When the average buyer is no longer average

Although house prices have risen rapidly relative to incomes over the last twenty years, mortgage repayments for current buyers are well within historically affordable levels. That affordability can generally be explained by the current record low mortgage rates, with raising a deposit and the long term costs of ownership now the biggest issues for prospective first time buyers.

The fall in mortgage rates and associated rise in loan-to-income (LTI) multiples over the period has been an important factor in driving house price rises. However, a basic model comparing the average of non mix-adjusted house prices to a price calculated according to average incomes, prevailing LTIs, and the long term average loan-to-value ratio (LTV) suggests this effect only accounts for ~60% of house price growth between 1994 and 2014. With income the only other variable in the model, the remaining growth is explained by a divergence between the actual income of buyers and the overall average household income from the mid 2000’s onwards. The average buyer no longer has an average income.
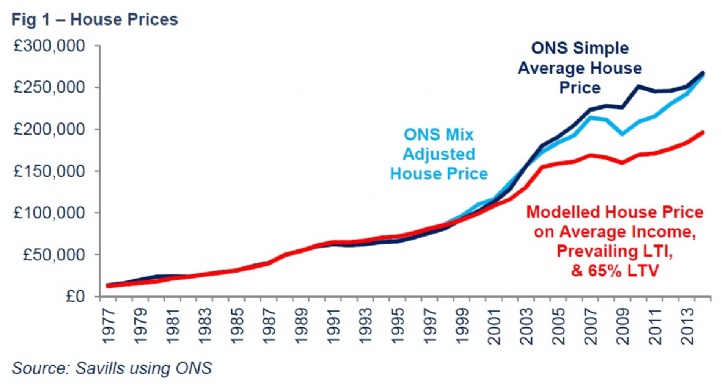
House prices

The gap between the actual and modelled house price in the above chart opens up from around 2003/04, which is also a key period in the chart below. This shows the number of mortgage borrowers by income band and, although the values are in nominal terms, it highlights the decline in the number of lower income buyers during the early to mid 2000s. It also shows the shift to higher income buyers during the 2005-07 period and their dominance in recent years. Home ownership is in general now limited to those who are both income and equity rich. It is for this reason that the average age of first time buyers has barely changed in recent years (despite some commentary to the opposite). You can either afford to buy and do so at similar ages to previous first time buyers, or you can’t afford to and so don’t buy.

Distribution of borrowers income

The chart below (Fig 4) further reinforces this shift in buyer incomes. It shows the mean gross income for both home movers and first time buyers against a selection of gross income deciles of all households in real terms. One possible explanation for at least some of these changes in buyers’ income could be the shift to joint income mortgages. Unfortunately I don’t have access to data on this trend prior to 2005 and Fig 5 suggests it was already well established by then.

With increasing home ownership firmly in the Government’s sights, the challenge for them will be in how to take a tenure that currently only really works for income rich (and typically equity rich) households, as per Fig 6, and make it accessible for those currently living in the rented sectors and sitting at the bottom of the income distribution, as per Fig 7. Many of the currently proposed solutions (e.g. Right to Buy and Starter Homes) will still be unaffordable to households on the lowest incomes and that could potentially lead to tensions between the Government and market regulators. Some parts of Government are now touting shared ownership as a possible solution to this issue and I’ll look at whether that could work for lower income households in a future note.

Mean buyer incomes versus income deciles for all households

There may be sample change issues in the buyer income data between 2003 and 2005, which accounts for some of the changes in income, in particular the volatility in first time buyer income between 2002/03 and 2003/04.

Even if the exact timings in the income shift are distorted by sample changes, the average buyer now has a much higher income relative to the country as a whole than in previous decades.

Number of mortgage sales by income basis

Data on the split between sole and joint income mortgages is limited prior to 2005. Since then, joint income mortgages have accounted for around 52% of primary mortgages sold.

Perhaps of more interest, given the big increase in the number of £50k+ income borrowers during 2006-07, is that 46% of incomes weren’t verified during the period.

Distribution of homeowners income
Distribution of income by tenure

Other articles within this publication

23 other article(s) in this publication