
Research article

Rents and returns

Imperfect data

The private rental market has become an important part of the UK housing market over the last two decades. This looks set to continue in coming years despite the Government being enthralled by homeownership. Unfortunately, our understanding of the private rental market is severely hampered by a lack of publicly available data. I have looked at the expansion of the sector in a previous note (http://sav.li/3qz) but the lack of comprehensive pricing data presents a serious challenge to attracting further institutional investment into the sector.

There are now a number of rental indices being regularly published but my suspicion is that the majority are released for marketing purposes given the difficulty in obtaining historic trend data. Even with the ONS experimental index, there is no single reliable source for longer run rental data. The Economist gets around this issue by using the rental component of inflation as replicated in the chart below and it’s an approach I have also used. However, it does have some issues as it includes rents paid by social rented tenants and these appear to have risen faster than private rents in recent years (table opposite). Choosing which house price index to benchmark against is a further complication when trying to assess affordability.
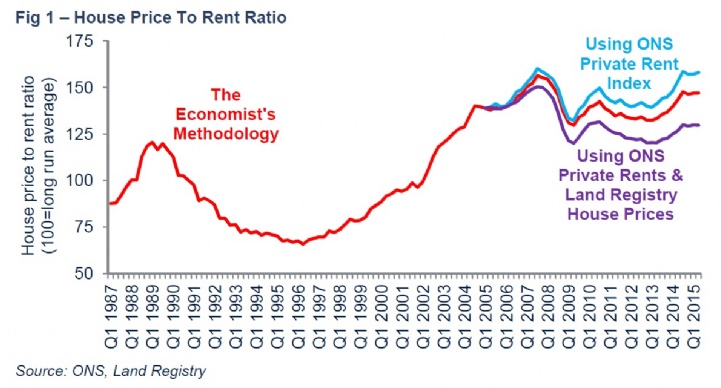
House price to rent ratio


The release of the ONS experimental private rental index is a step in the right direction, particularly since it was revised at the beginning of the year. However, there are still outstanding questions given it measures all rents paid and appears to under-report rental growth relative to some other indices based on data from new lettings. However, the ONS have recently published a report that suggests a large part of their index’s lower growth since 2010 relative to the underlying Valuation Office Agency data is due to changes in the mix of properties being measured. Adding properties in more affluent areas to the VOA sample has helped drive up average rents by an additional 17% (35% total) but is not reflective of the actual underlying trend of 11%.

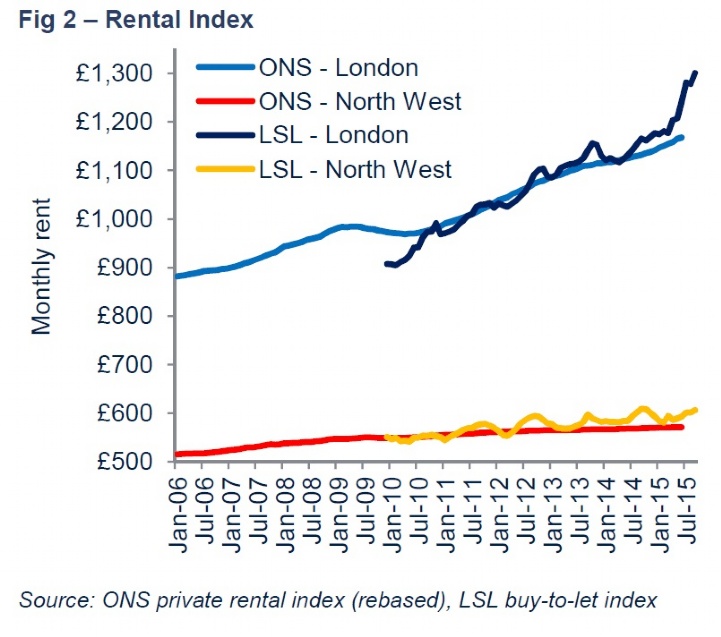
The charts below compare the ONS index against the LSL Buy-to-Let index which is based on new lettings. These charts suggest that the underlying trend in growth is similar but the LSL index is more volatile over short periods due to its focus on new lettings. A key test for the two indices will be the extent to which the recent strong London growth in the LSL index is picked up by the ONS index.

Rental index
Rental growth

Further comparison between the two indices is possible on a gross yield basis as per the chart below. I have modelled an indicative yield using the ONS rental index and Land Registry house prices. This analysis suggests that the two indices are broadly in line during the period covered by the LSL index. However, a comparison to the Savills prime central London yield suggests that the indicative yields produced by the model for the period prior to 2010 may not be correct. Given that a larger and higher quality rental sample became available to the ONS from 2010, I remain hesitant about the quality of the ONS rental indices before then.

Looking ahead, it is apparent that we also need official statistics on rents paid for new lettings, not just all lettings. The data for this should be available through the Tenancy Deposit Scheme and I have heard that DCLG already use it internally. Creating indices from this data will not solve our historic issues but would improve our ability to monitor and analyse the rental market in the future.

Residential buy to let gross income yields

These yields (at least those post 2010 that we have confidence in) reflect the returns achieved by individual investors, many with a buy-to-let mortgage. The charts below provide alternative data on returns achieved by institutional investors in the residential market.

Portfolio Investment Returns

IPD have provided information on UK residential portfolio investment returns since 2001 and it provides useful information on the market. However, the data is heavily skewed towards central London including some managed estates and has suffered from a declining sample size in recent years. It is always important to understand what it is measuring.

Selected residential investment deals

Savills has a large database covering the emerging residential investment market. It includes build-to-rent developments and transfer of existing portfolios. The strength of competition from small scale investors in the new build market means that many institutional investors struggle to make build-to-rent financially viable in low yield markets. That’s an issue I will look at in a future note.

Other articles within this publication

23 other article(s) in this publication