
It is now easier than ever to find out how much your new neighbours paid for their house thanks to online data. It is far trickier finding out if the house is comparable to yours in size. Land Registry house price data is invaluable but unfortunately it only records the type of property sold e.g. detached, semi-detached, terraced or flat.
If you’re lucky, the property details will still be on an agent’s/listing website with a floor plan. Aside from third parties with access to mortgage lending data, there is no easy publicly accessible way to find out how big an individual property is. Wider access to floor area data would improve transparency in pricing by allowing people to quickly compare house prices on a £ per m² or ft² basis.
So how big are our homes? The 2012/13 English Housing Survey provides some useful evidence for England and indicates that the mean property floor area is 92.3 m² (993.5 ft²). For comparison, the 2011/12 survey indicates that an average floor area for flats is 56.9 m², for terraced houses is 82.6 m², for semi-detached houses is 93.2 m² and for detached houses is 151.7 m².
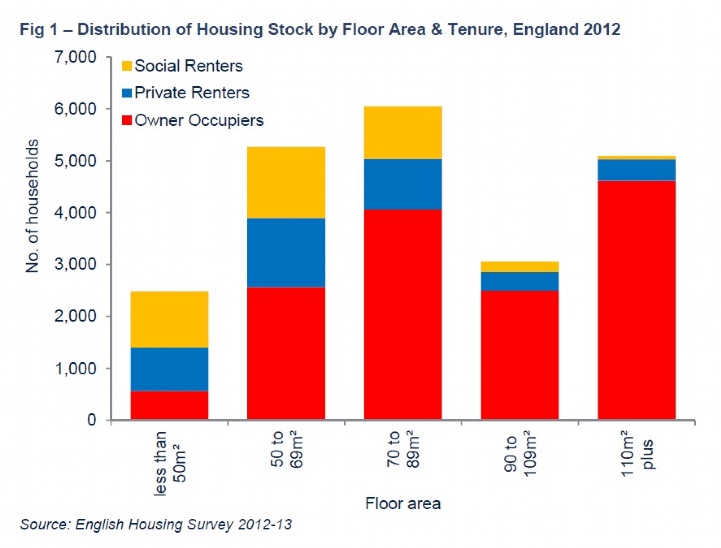
As with any average, that figure doesn’t tell us much about the distribution of property sizes. Fig 1 below shows the distribution tending towards smaller homes and highlights the divergence by tenure. The average size of an owner occupied home is 105 m², a private rented home is 74 m² and a local authority home is 63 m². Some of that difference will be accounted for by the different mix of property types (e.g. flats versus houses) in each tenure but it is perhaps not surprising that higher levels of overcrowding are found in the two rental tenures.


.png)