
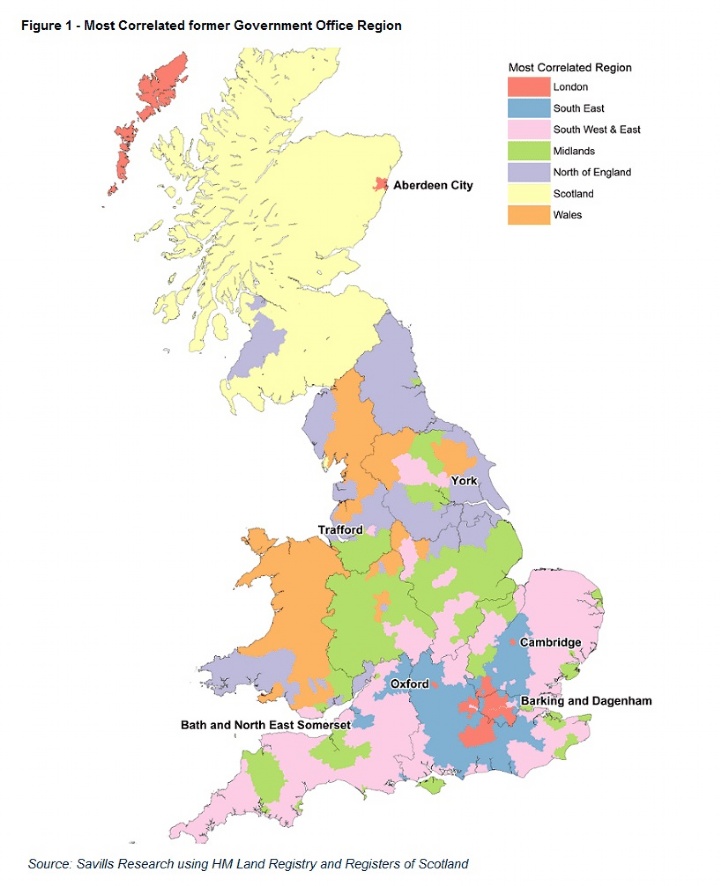
Bath may be located in the South West, Oxford in the South East, Cambridge in the East of England and Aberdeen in Scotland but trends in house price growth suggest that's not completely true in terms of housing markets. The correlation between regional and local level price growth suggests that many local markets actually have a stronger correlation with a region other than the one in which they are physically located.
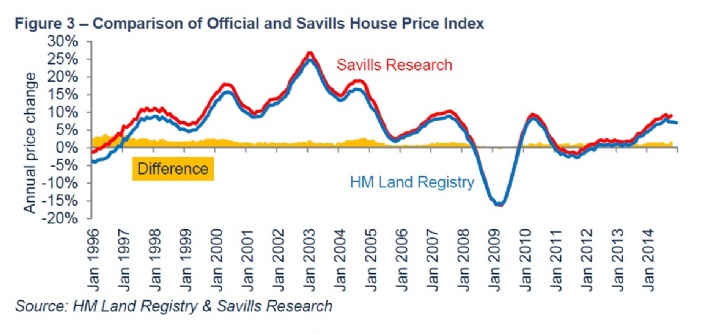
We have created our own version of the Land Registry house price indices but based on local authorities rather than unitary authorities/counties. That allows us, for example, to look at the performance of Cambridge city rather than just the wider Cambridgeshire market. Using these indices, we have created a map to show the former Government Office Region with which each local authority has the strongest correlation based on house price growth.
Amongst other trends, the correlation map highlights London's spread beyond its official boundary with red areas in the Home Counties, Cambridge and Oxford. It also shows some of the limitations in using the former Government Office Regions to assess housing markets. It is perhaps more important to understand how cities interact with their surrounding areas.

.png)