
The issue of affordability is at the centre of the debate around our dysfunctional housing market. For many (31% of existing households and 55% of new purchasers) that affordability is determined by their capacity to borrow in the mortgage market. With limited interest-only mortgages available, most prospective borrowers will be assessed for their capacity to afford the regular repayments of a capital repayment mortgage.
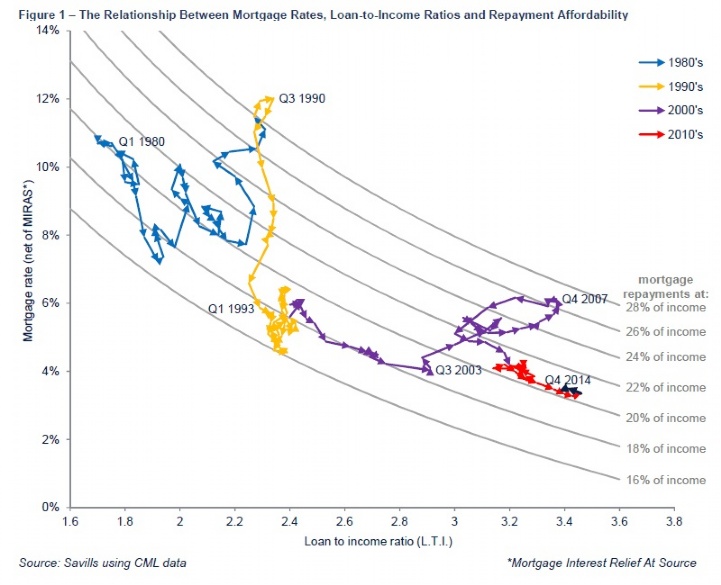
The regular cost of a capital repayment mortgage is determined by three variables: the principal borrowed (P), the term of the loan (T), and the mortgage rate (r) as shown by the formulae opposite. The chart below attempts to show how the relationship between these variables has changed for actual first time buyers over time (the term is fixed at 25 years).
The variables are normalised by gross household income so the principal borrowed is represented by the loan-to-income ratio on the X-axis, the mortgage rate (net of MIRAS*) is shown on the Y-axis, and the grey curved trend lines show repayment affordability as a percentage of income. The coloured lines show the actual trend in first-time buyer affordability with each arrow representing the change over a three month period.
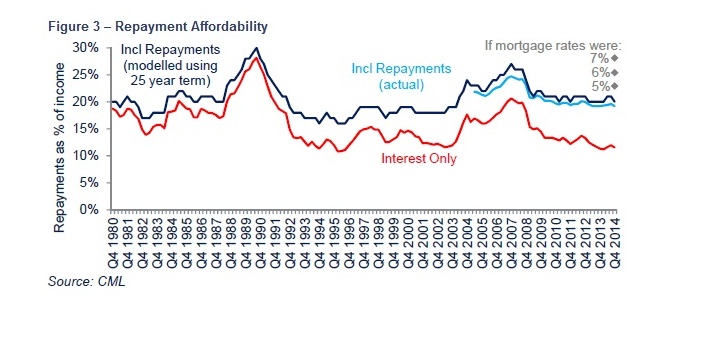
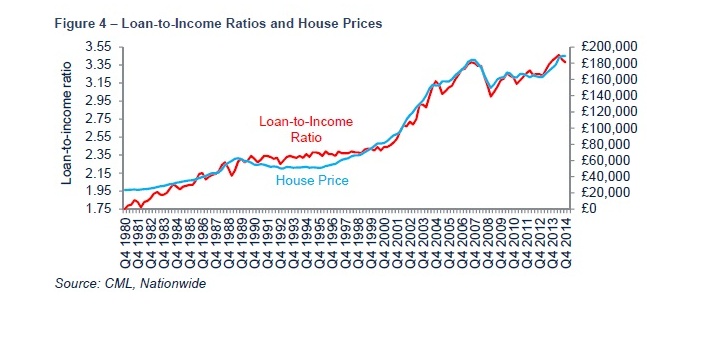
Starting at the top left of the chart in the early 1980s, mortgage rates were high so buyers could only borrow low multiples of their income (1.7 rising to 2.3). Higher rates and the withdrawal of MIRAS pooling in the late 1980s then stretched repayment affordability to 30% of income until the price crash of the early 1990s hit. Mortgage rates then fell and loan-toincome levels remained relatively static through the 1990s, hovering at around 2.4 times income with mortgage repayment affordability around 16-20% of gross household income.



.png)